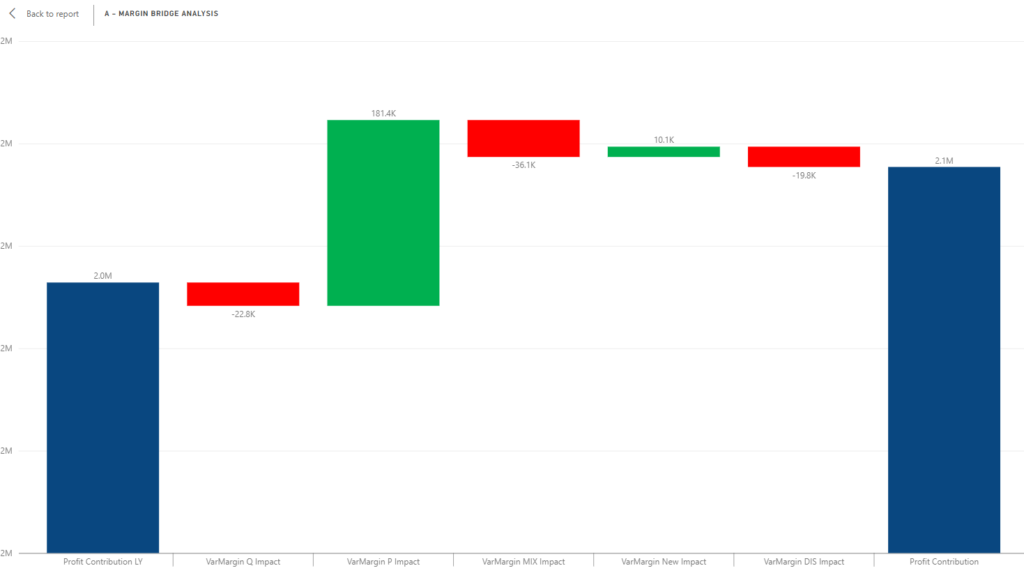
It is crucial for strategic decision-making to understand the nuances behind fluctuations in revenue and margin. One powerful tool that unveils these intricacies is the Margin Bridge, also known as the Variance Tree. This analysis illuminates the path of revenue and margin changes over time, dissecting the impact of shifts in price, volume, and product mix. Let’s delve into the world of Margin Bridge analysis and discover how it can be your trusted ally in navigating the complex landscape of revenue management.
Breaking Down Revenue and Margin Changes
At its core, the Margin Bridge analysis is a comprehensive examination of the factors influencing the changes in revenue and margin over different periods. It serves as a visual representation, breaking down the overall variances into distinct components—price variance, volume variance, and product mix variance. Price variance reflects the impact of changes in pricing strategy, volume variance encapsulates the influence of sales volumes, and product mix variance dissects the effects of alterations in the mix of products sold. By isolating these components, businesses gain a granular understanding of the drivers behind their financial performance.


How Margin Bridge Guides Strategic Decision-Making
The Margin Bridge acts as a diagnostic tool, offering valuable insights into the cause-and-effect relationships between pricing decisions, sales volumes, and product offerings. For instance, if there’s a dip in revenue, the Margin Bridge allows you to pinpoint whether it’s due to a decrease in price, a shift in the product mix, or a decline in sales volume. This level of clarity empowers businesses to make informed adjustments to their revenue management strategies. Whether it’s optimizing pricing structures, revising product offerings, or implementing targeted marketing campaigns, the Margin Bridge guides strategic decisions with precision.
